The Bebras Malta Stats pages provide an overview of participation, score distributions, and performance trends from recent Bebras Malta challenges.
These reports are intended to support teachers, schools, and organisers in gaining a clearer understanding of how students engaged with the competition across different age categories and school groups. The insights highlight participation patterns, score distributions, and general performance trends, while also providing context about the tasks and scoring system used during each challenge.
The Bebras challenge focuses on developing computational thinking through short problem-solving tasks that encourage logical reasoning, pattern recognition, and step-by-step thinking. Since the challenge is designed for multiple age groups, the reports also help illustrate how student performance and participation vary across different educational levels.
The statistics and visualisations presented in these reports are intended to provide an overall picture of engagement and achievement rather than direct comparisons between individual students or schools. Since the challenge tasks and scoring structures may vary from year to year, results should not be directly compared across different editions of the competition. However, the reports still provide useful insights for teachers by highlighting participation patterns, overall performance trends, and levels of student engagement across different age groups.
Note: Score distributions should not be compared directly across different years, since the challenge questions and scoring structures may vary from one edition to another.
2025 Challenge Insights
The 2025 Bebras Malta challenge saw participation from students across multiple age groups and schools.
The sections below provide an overview of participation patterns, score distributions and general performance trends observed during the challenge.
Participation Insights

Participation by Age Group
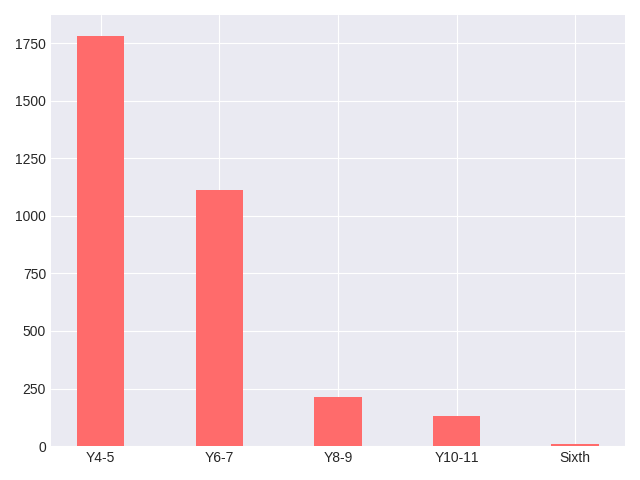
A total of 3,499 students took part in the competition.
The largest group is Years 4–5 with 1,783 students (just over half of all participants). This is followed by Years 6–7 with 1,112 students.
Participation drops in older groups:
- Years 8–9: 215 students
- Years 10–11: 130 students
- Sixth Form: 9 students
This shows that participation is concentrated in the middle years.
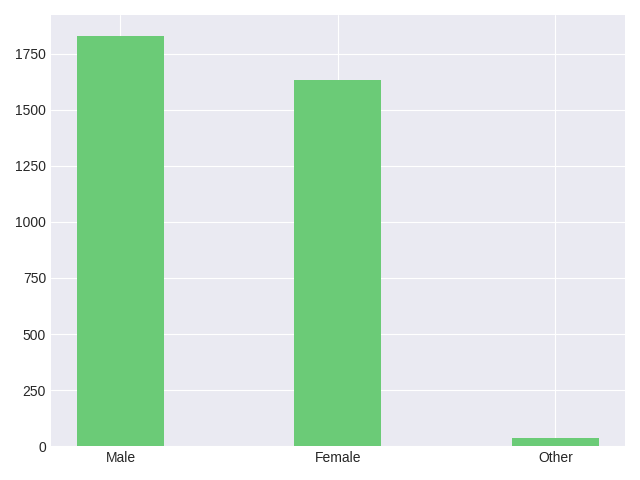
Gender Distribution
Male students: 1,831
Female students: 1,633
Other: 35
Participation is well balanced between male and female students, with only a small difference between the two groups. This suggests the competition is accessible and engaging across genders.
Public vs Other Schools
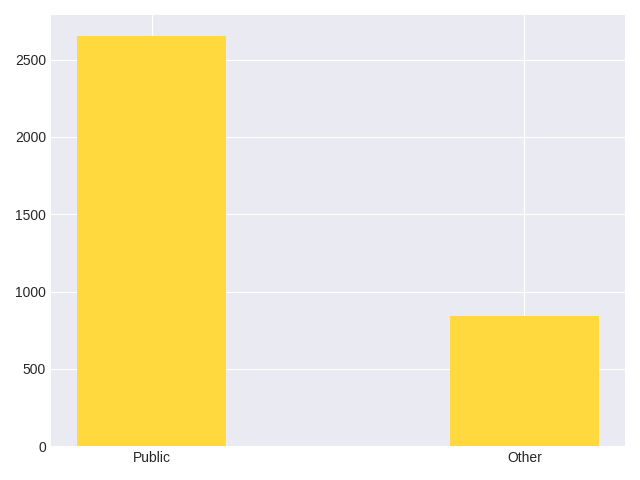

Public schools: 2,656 students
Other schools: 843 students
Most participants come from public schools (around three quarters of all students). This shows strong engagement across the public sector, while other schools also play an important role.
Gender Distribution in Public Schools

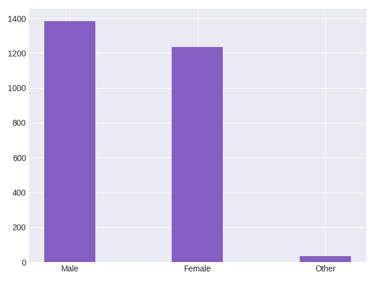
Male: 1,385
Female: 1,236
Other: 35
Total: 2,656
Participation within public schools is balanced between male and female students, showing consistent engagement across genders.
Understanding the Tasks
The competition is made up of short problem-solving tasks designed to develop computational thinking skills. These tasks encourage students to think logically, recognise patterns, and break down problems into steps.
The tasks vary in difficulty (Easy, Medium, and Hard), allowing all students to engage while also providing challenge.
You can explore the exact tasks students completed here.
How Scores Are Calculated
Students complete tasks classified as Easy, Medium, and Hard, depending on the age category. Each question type has different scoring, and incorrect answers receive a small penalty.
Easy: +6 correct, -2 incorrect
Medium: +9 correct, -3 incorrect
Hard: +12 correct, -4 incorrect
There is no penalty for unanswered questions.
The number of questions varies by age group. To ensure that scores do not become negative, students begin with a starting score.
For the 2025 challenge:
Years 2–3: start at 29, maximum 116
Years 4–5: start at 40, maximum 148
Years 6+: start at 45, maximum 180
Scores therefore reflect:
accuracy,
question difficulty,
and the balance between correct and incorrect answers.
More information can be found here.
Score Distributions
Year 2-3
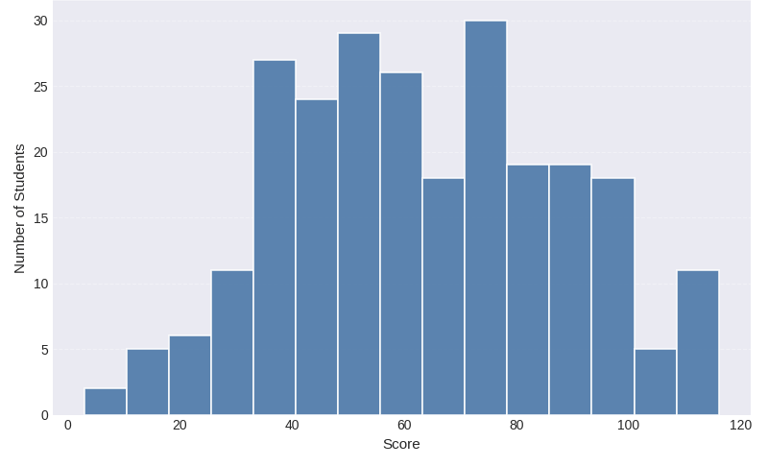
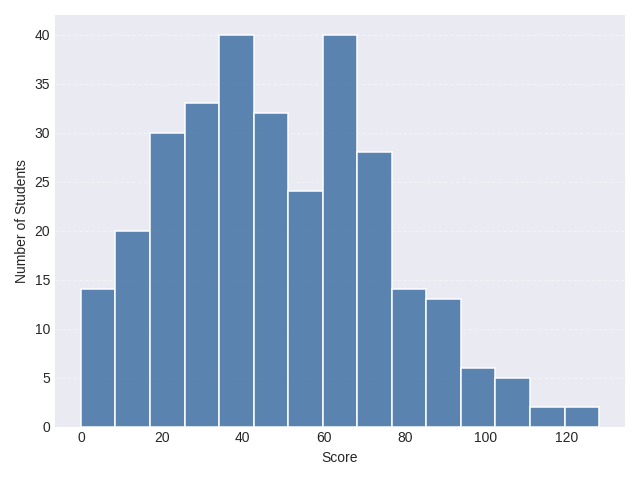
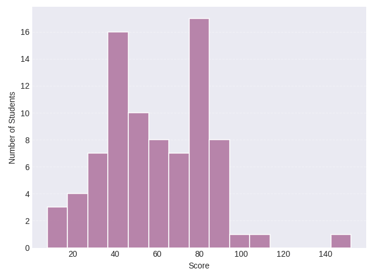
In this group, most scores are concentrated in the lower to middle range, with a clear clustering around the centre. Only a small number of students reach higher scores, with the highest result in this category reaching 116. This reflects an early stage of development, where most students are still building their problem-solving skills, while a few are beginning to show stronger performance.
Year 4-5
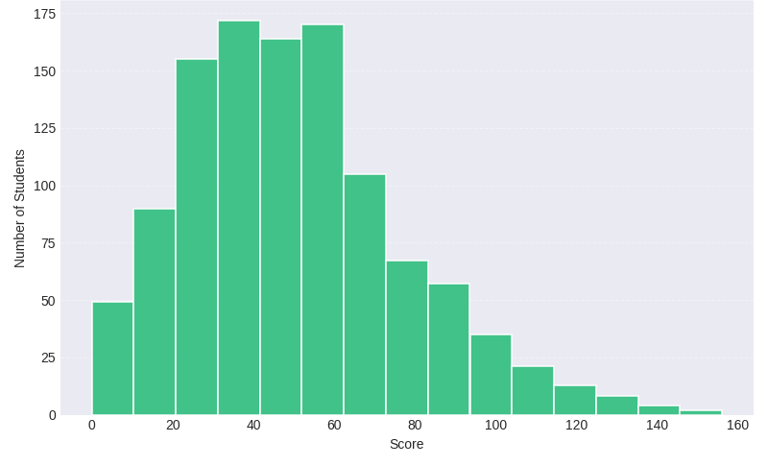
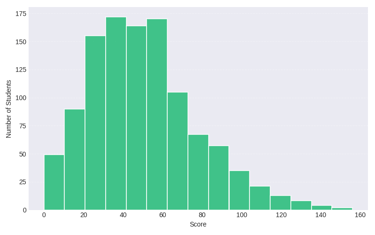
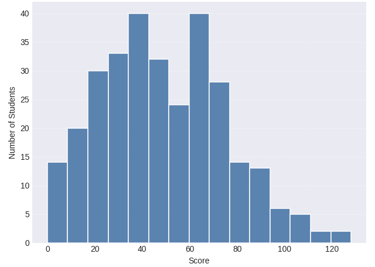
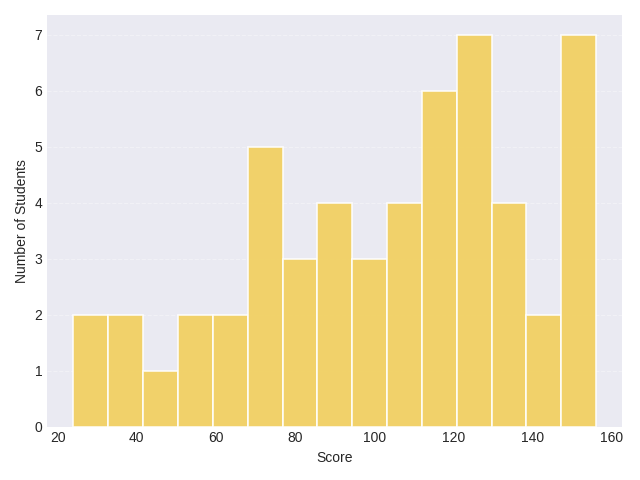
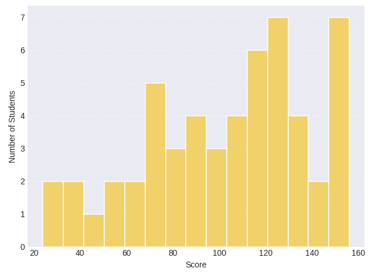
Scores in this category are spread across a wider range, with a strong concentration in the middle and a noticeable number of students reaching higher scores. The highest score achieved in this group was 136, showing that several students were able to perform strongly across the tasks. Compared to younger groups, there is a clearer presence of higher-performing students, suggesting increasing confidence and a broader range of abilities within the group.
Year 6-7
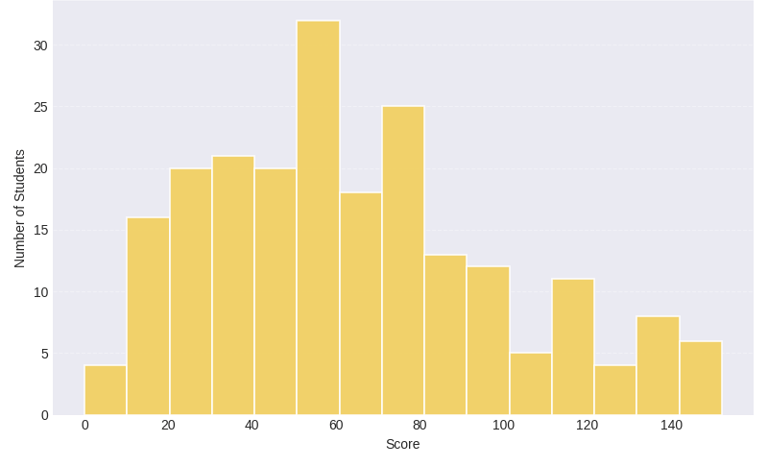
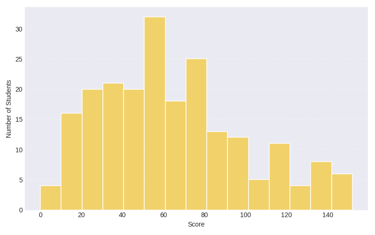
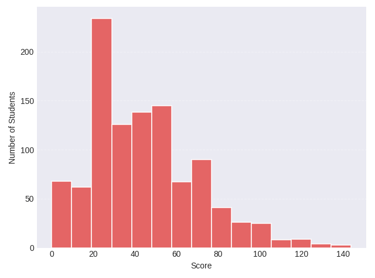
Results in this category are more spread out, with students appearing across both middle and higher score ranges. The distribution is less tightly grouped, showing greater variation between students. The highest score achieved in this group was 152, highlighting that some students performed strongly across the tasks, while others remained at a mid-level.
Year 8-9
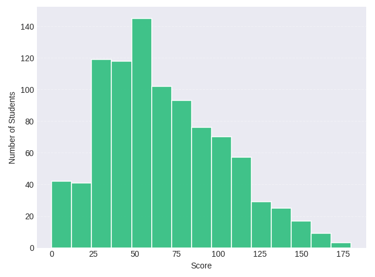
In this group, scores are distributed across a broad range, with most students clustered around the middle. Higher scores are present but less frequent, with the highest result in this category reaching 156. This suggests that many students are progressing steadily, while fewer are reaching the top end of the score range.
Year 10-11
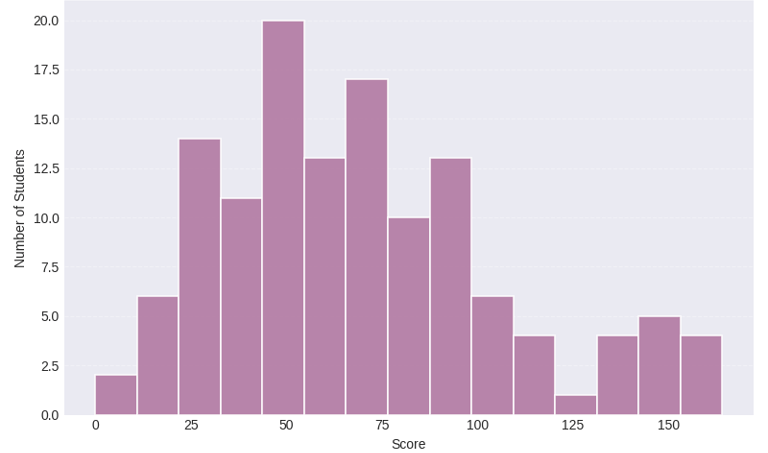
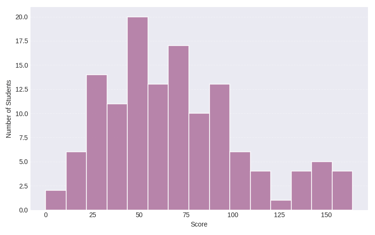
Scores in this group are more concentrated, with most students falling within a narrower range and fewer extreme values. There are fewer very high or very low scores compared to other categories, although the highest score achieved in this group reached 164. This suggests a more consistent level of performance among those who take part.
The charts below show the distribution of student scores across each age category, highlighting overall performance trends and score variation within each group. Sixth Form distributions are excluded due to the small number of participants.
The charts below show the distribution of student scores across each age category, highlighting overall performance trends and score variation within each group. Sixth Form distributions are excluded due to the small number of participants.
2024 Challenge Insights
The 2024 Bebras Malta challenge saw participation from students across multiple age groups and schools.
The sections below provide an overview of participation patterns, score distributions and general performance trends observed during the challenge.
Participation Insights
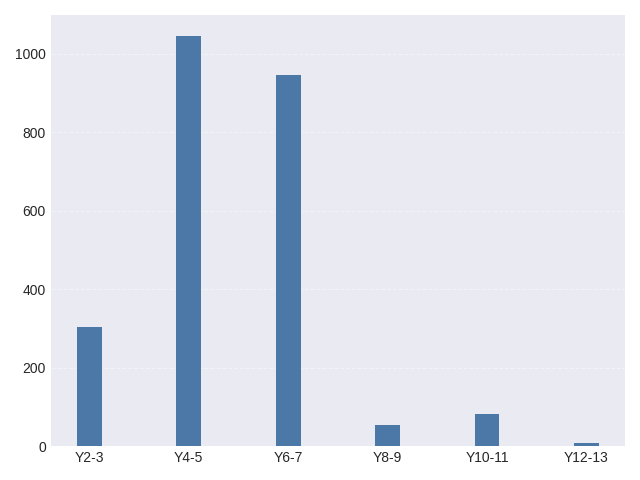
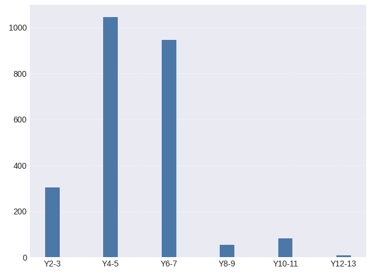
Participation by Age Group
A total of 2,440 students took part in the competition.
The largest group is Years 4–5 with 1,046 students, followed by Years 6–7 with 946 students. Participation drops significantly in older groups, with much smaller numbers in Years 8–9, Years 10–11, and Years 12–13.
This shows that participation is concentrated in the middle years.
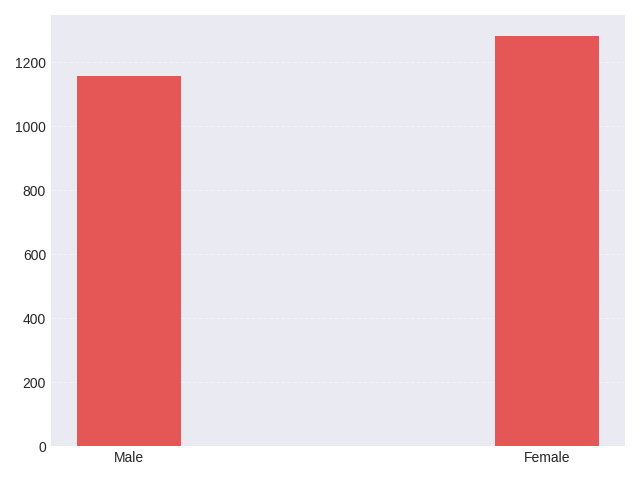
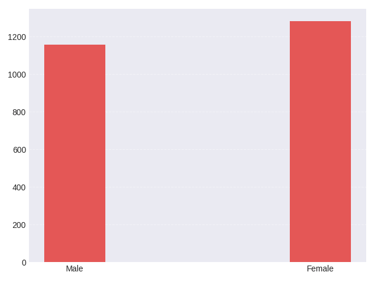
Gender Distribution
Male students: 1,157
Female students: 1,283
Participation is fairly balanced between male and female students, with a slightly higher number of female participants.
Public vs Other Schools

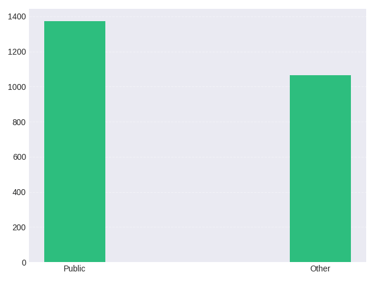
Public schools: 1,374
Other schools: 1,066
Participation is split between public and other schools, with a slightly higher number from public schools.
Gender Distribution in Public Schools
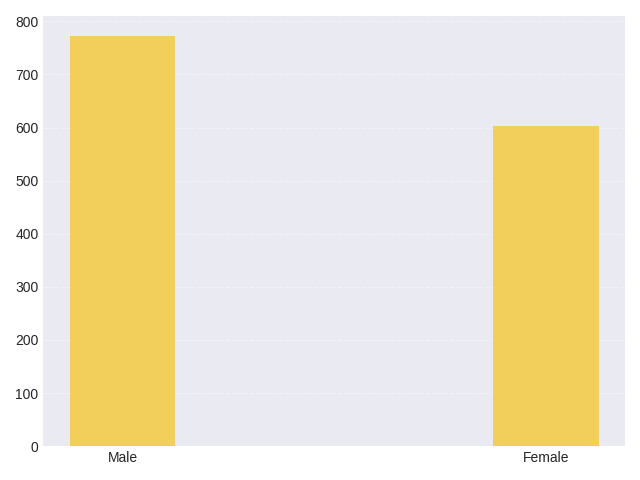

Male: 772
Female: 602
Total: 1,374
Within public schools, participation is fairly balanced, with slightly more male students taking part.
Understanding the Tasks
The competition is made up of short problem-solving tasks designed to develop computational thinking skills. These tasks encourage students to think logically, recognise patterns, and break down problems into steps.
The tasks vary in difficulty (Easy, Medium, and Hard), allowing all students to engage while also providing challenge.
You can explore the exact tasks students completed here.
How Scores Are Calculated
Students complete tasks classified as Easy, Medium, and Hard, depending on the age category. Each question type has different scoring, and incorrect answers receive a small penalty.
Easy: +6 correct, -2 incorrect
Medium: +9 correct, -3 incorrect
Hard: +12 correct, -4 incorrect
There is no penalty for unanswered questions.
The number of questions varies by age group. To ensure that scores do not become negative, students begin with a starting score.
For the 2024 challenge:
Years 2–3: start at 32, maximum 128
Years 4–5: start at 36, maximum 144
Years 6+: start at 45, maximum 180
The 2024 trial competition was based on questions from the 2023 challenge, with slightly different question distributions for some age groups.
Scores therefore reflect:
accuracy,
question difficulty,
and the balance between correct and incorrect answers.
More information can be found here.
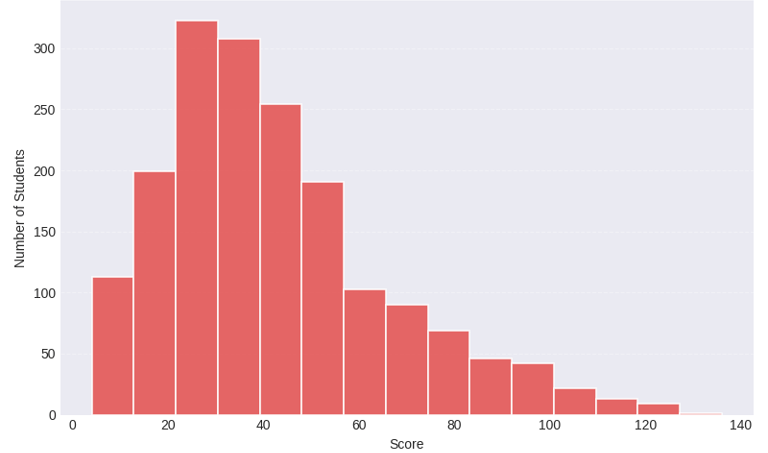
Score Distributions
Year 2-3
In this group, most results fall within the lower to mid score range, with many students grouped near the centre. A smaller number of students reached higher results, with the top score in this category reaching 128. This reflects an early stage of skill development, where students are still becoming familiar with problem-solving tasks, while a few begin to show stronger performance.
Year 4-5

Results in this category extend across a broader span of scores, with a large number of students achieving mid-level results and some reaching higher scores. The highest result recorded in this group was 144, showing that several students were able to perform strongly on more challenging tasks. Compared to younger students, there is a clearer presence of stronger outcomes, suggesting increasing confidence and a wider range of ability within the group.
Year 6-7

Results in this category show a wider spread, with students appearing across several score levels. Some achieve higher scores, while many remain closer to the middle. The top score achieved in this group was 156, reflecting a varied set of performances and different levels of confidence with the tasks.
Year 8-9
In this group, scores are distributed across the scale, with most students positioned in the middle range. Higher scores are visible but occur less frequently, although the highest score achieved reached 180. This indicates that many students are progressing steadily, while a smaller group is able to perform strongly across the full range of tasks.
Year 10-11

In this group, results are more tightly grouped, with most students falling within a narrower band of scores. There are fewer very high or very low results, although the highest score achieved in this category was 152. This suggests a more consistent level of performance among the students who take part.
The score distribution charts below show how student results were spread across each age category. These distributions help provide an overview of overall performance, highlighting where most students scored and how results varied within each group. Please note that Sixth Form score distributions are not included, since the number of participants in this category was too small to provide a meaningful overall distribution.